Load Based Teaming in Action
A few days ago I came across a thread on the VMTN forums regarding an application with high network utilization in which the actual LBT load balancing was causing application issues. The individual wanted to actually see in the logs when and where this was happening (which I will get to). Thought it would be good to see that in action and briefly describe that as well as I was already in some LBT configurations later that day and testing a new vMotion network.
For those who are not familiar with VMWare Load Based Teaming, this feature allows you to better utilize your physical uplinks in a more balanced manner. By default, the Load Balancing option is “Route Based on originating virtual port”. Even though the terminology states Load Balancing – this does no true load balancing. This option essentially round robins the VMs VMNIC during power on. For example, VM1-VM4 with vmnic0 and vmnic1 on a particular host, VM1 = vmnic0, VM2 = vmnic1, VM3 = vmnic0, VMS4 = vmnic1, in the order they were powered on. These bindings are static until you power off and power on the virtual machine or it is vMotioned to another host. This works well to distribute the VMs vnic to separate interfaces but does nothing during times of network saturation on a particular physical nic or interface.
LBT or “Route Based on Physical NIC Load” is an enterprise plus/VDS feature in which every 30 seconds the uplinks or pNICS are calculated to determine load. If during this sampling size the kernel detects the load is above 75% of utilization (MbTX/s MbRX/s), it will dynamically move the VM(s) with the highest I/O to another pNIC/uplink. Pretty slick(!) and it is being used in the majority environments I have built (granted you have ENT+ licensing and are using the virtual distributed switch). One caveat is this feature cannot be used with NSX – this was discussed in a training session and outside the scope of this discussion. So keep that in mind of you plan to roll NSX. One quick thing to note is when you enable LBT it uses the default “Route Based on originating virtual port” to initially assign the applicable vmnic. Then as 30 seconds pass the kernel determines load, and this continues on the duration you use this option.
To see this in action lets create some synthetic network traffic using a couple different methods. I will use PassMark Advance Network test to throw some large UDP blocks from one VM to another (through the VDS). I used the largest Fixed Block size possible and set the time to 45 seconds to trigger LBT. See below screen shots for PassMark settings on the VMs. One thing to note is I am targeting VMs on different hosts to ensure it traverses the VDS, traffic is both ways meaning run PassMark on the other VM as well.
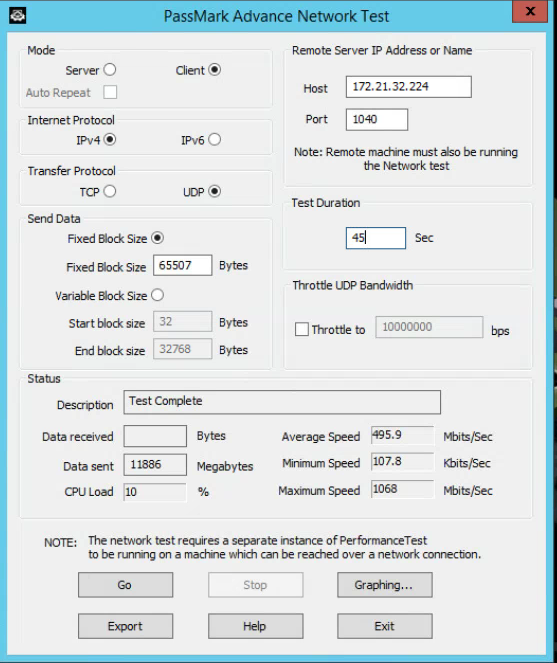
I initially thought this would be enough doing this with 4-5 VMs, however I could not saturate the 10GB link(s) in the LAB. So I turned to creating a couple large VMs (48 GB of RAM) and pounding on the RAM with Prime95 to dirty some memory.
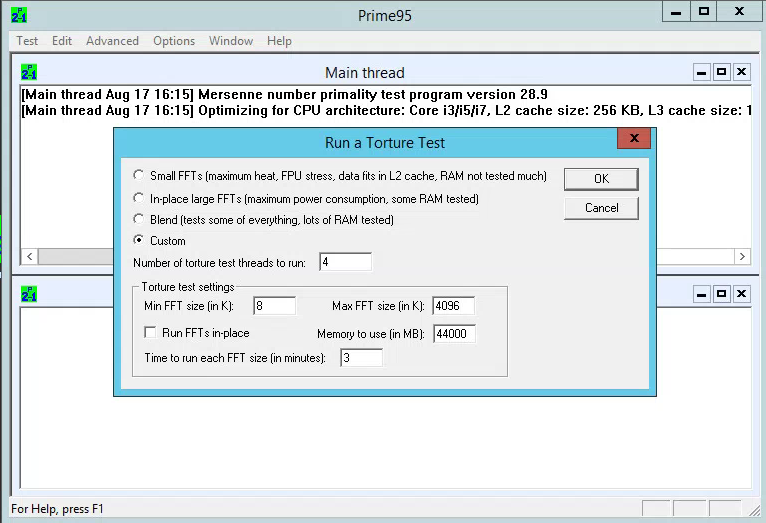
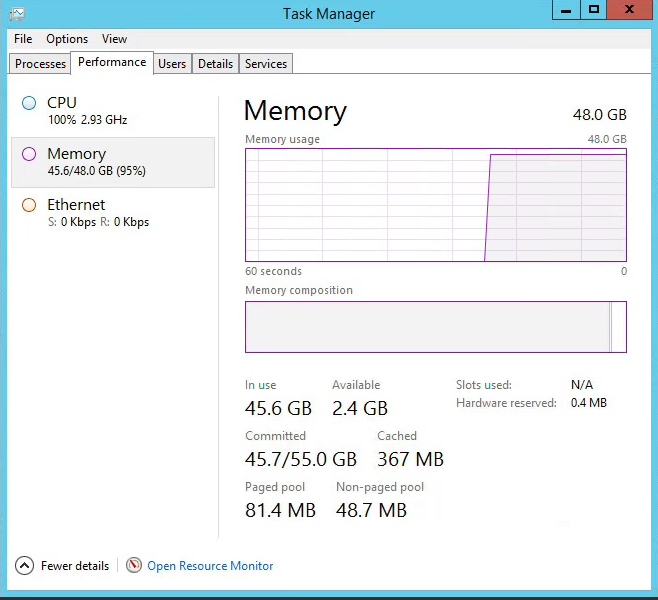
Then I could vMotion them between hosts while the above tests were running to soak the links while the dirty memory was copying over. Below you can see I set it to consume 44GB of the 48 I have assigned and also task manager ramping up.
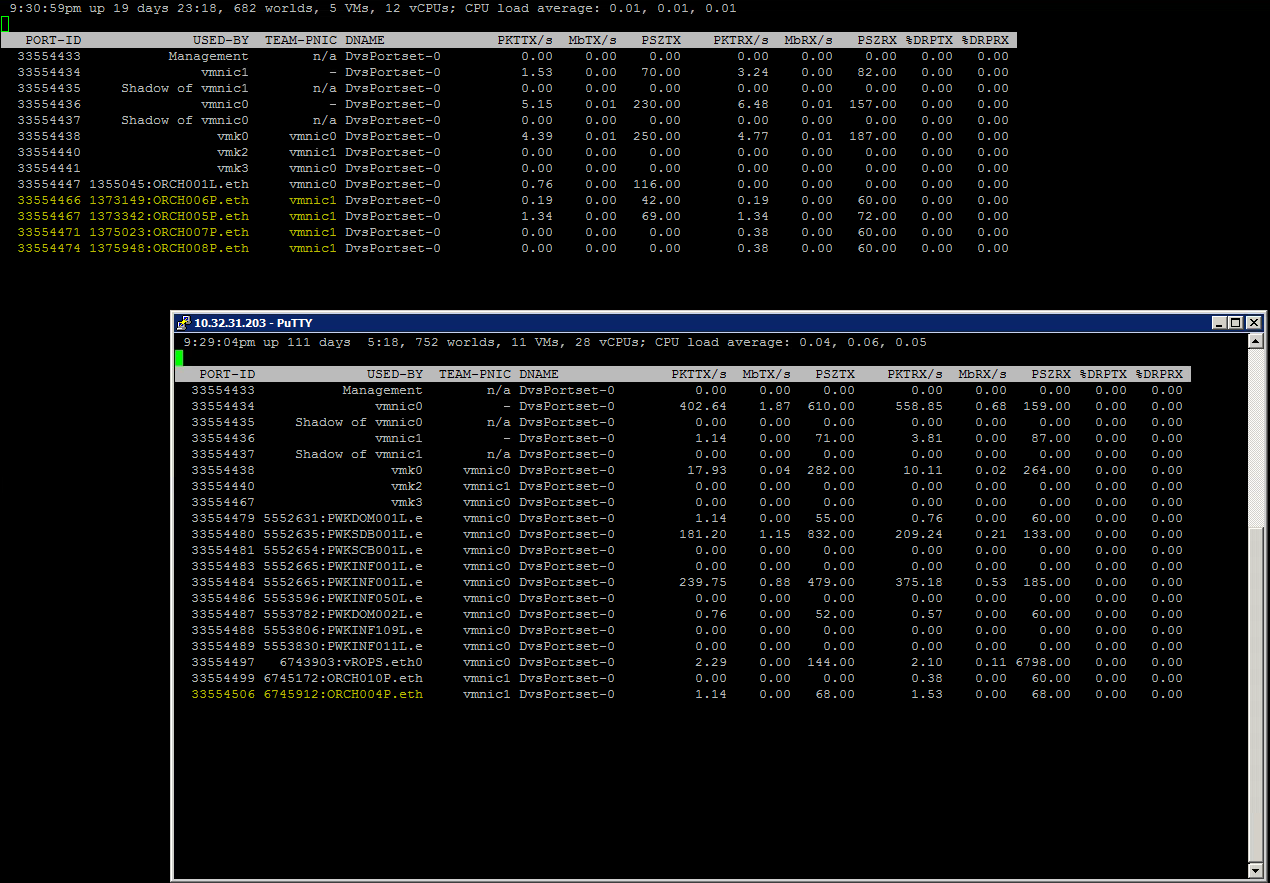
Now we have that setup, let’s look at the host under normal network load. On both hosts you can see the vmnic0/1 using practically nothing. In that same screenshot I have highlighted the VMs in which I am going to test with. These are all connected to vmnic1 on both hosts, so during the point of link saturation they should kick over to vmnic0. Also one thing to note is I pinned my vMotion network to one vmnic to drive more traffic over the link solely for this test. All VMs highlighted are running PassMark as well from one VM to another as well granted they are on different hosts.
PassMark kicked off and vMotions in “motion” – see below screen shot for activity on the host (yeah – lots of 1/0s, I mean traffic).
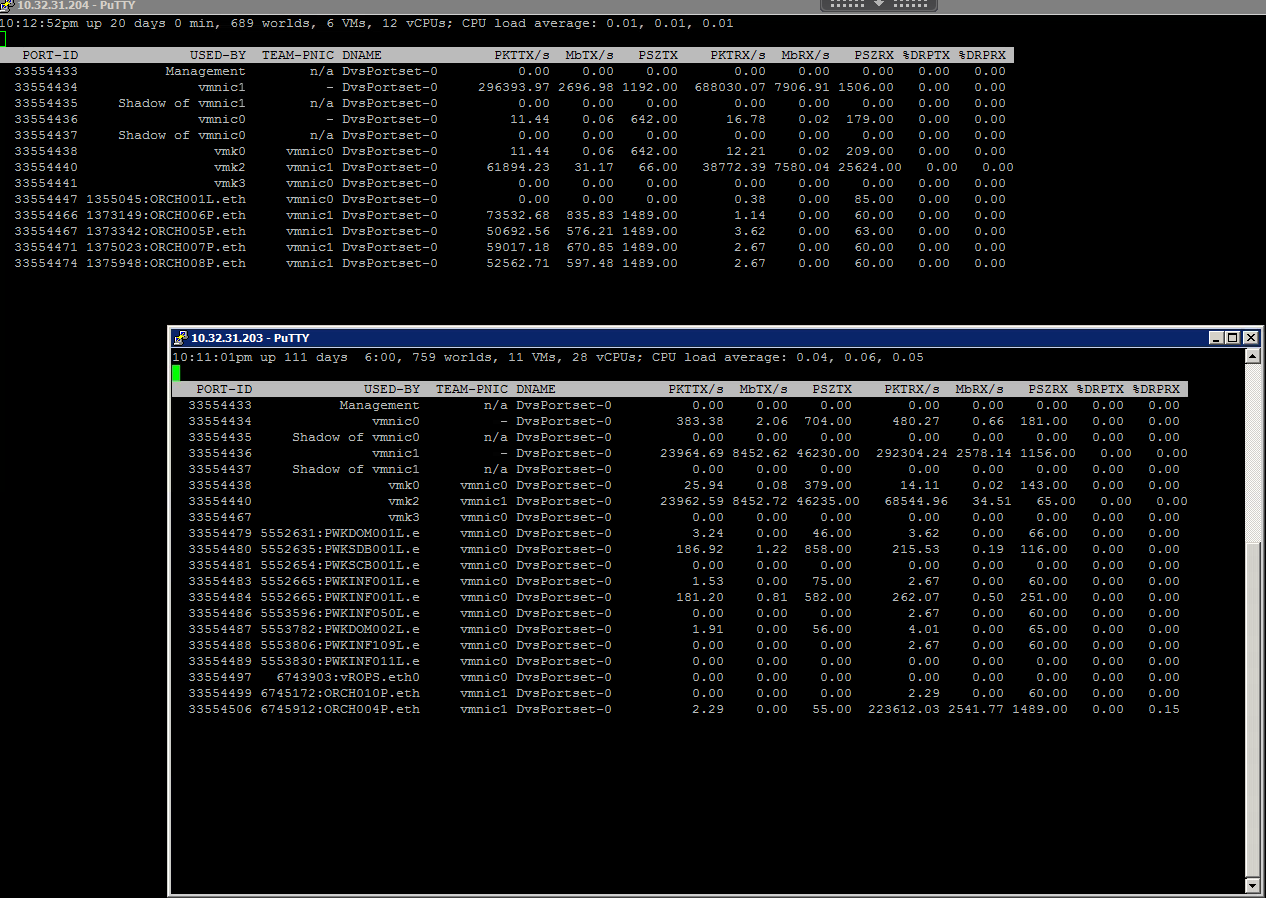
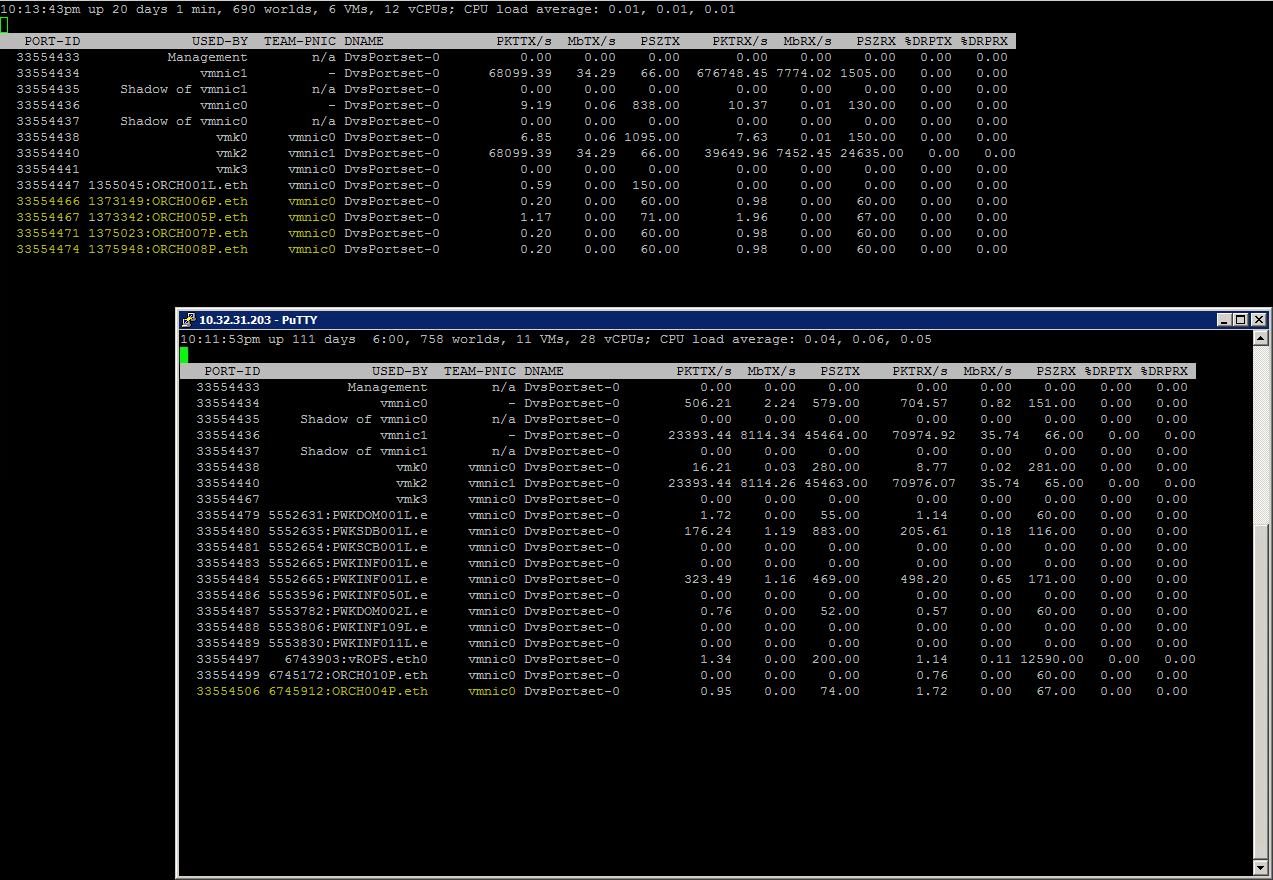
We can now see a large amount of traffic on this host. Once the PassMark test and vMotions are completed we can now see the VMs using another vmnic traversing a separate uplink (see below). In ESXTOP you can practically real time see this failover, granted the default 5 second refresh. LBT working as designed. **It is worth a quick note that the VM does have a very brief disconnect from the network during the flap.
Now to speak to actually seeing this in the logs, and how to troubleshoot when and where this failover or flap actually happens. We need to first find the DVPort ID the VM in which the failover occurred. In this example we will use the highlighted VM below. Use esxcfg-vswitch -l to see.
We now will want to match this up with the entries in the vmkernel log, the failover will look something similar to this in bold. You see the traffic resuming after the brief failover/disconnect. “2016-08-26T16:56:59.130Z cpu12:1426087)NetPort: 3101: resuming traffic on DV port 126
2016-08-26T16:56:59.130Z cpu12:1426087)Team.etherswitch: TeamESPolicySet:5938: Port 0x2000033 frp numUplinks 2 active 2(max 2) standby 0
2016-08-26T16:56:59.130Z cpu12:1426087)Team.etherswitch: TeamESPolicySet:5946: Update: Port 0x2000033 frp numUplinks 2 active 2(max 2) standby 0
2016-08-26T16:56:59.130Z cpu12:1426087)NetPort: 1573: enabled port 0x2000033 with mac 00:50:56:b0:5c:97
2016-08-26T16:56:59.143Z cpu12:1426087)NetPort: 1780: disabled port 0x2000033
2016-08-26T16:56:59.153Z cpu12:1426087)Vmxnet3: 15242: Using default queue delivery for vmxnet3 for port 0x2000033
2016-08-26T16:56:59.154Z cpu12:1426087)NetPort: 3101: resuming traffic on DV port 126”
There you have it, hope you get a chance to enable and leverage this feature in your environment to help truly load balance your physical uplinks.


Leave A Reply